How to work with massive media data sets?
Early 21st century media researchers have access to unprecedented amounts of media–more than they can possibly study, let alone simply watch or even search. A number of interconnected developments which took place between 1990 and 2010–the digitization of analog media collections, a decrease in prices and expanding capacities of portable computer-based media devices (laptops, tablets, phones, cameras, etc.), the rise of user-generated content and social media, and globalization (which increased the number of agents and institutions producing media around the world)–led to an exponential increase in the quantity of media while simultaneously making it much easier to find, share, teach with, and research. Waiting to be “digged” into are hundreds of billions of videos on YouTube and photographs on Facebook (according to the stats provided by Facebook in the beginning of 2012, its users upload 7 billion images per month), millions of hours of television programs digitized by various national libraries and media museums, millions of digitized newspaper pages from the nineteenth and twentieth centuries (1), 150 billion snapshots of web pages covering the period from 1996 until today (2), and numerous other media sources. (For more examples of large media collections, see the list of repositories made available to the participants of Digging Into Data 2011 Competition.)
How do we take advantage of this new scale of media in practice? For instance, let’s say that we are interested in studying how presentation and interviews by political leaders are reused and contextualized by TV programs in different countries (this example comes from our application for Digging Into Data 2011[iii]). The relevant large media collections that were available at the time we were working on our application (June 2011) include 1,800 Barack Obama official White House videos, 500 George W. Bush Presidential Speeches, 21,532 programs from Al Jazeera English (2007-2011), and 5,167 Democracy Now! TV programs (2001-2011). Together, these collections contain tens of thousands of hours of video. We want to describe the rhetorical, editing, and cinematographic strategies specific to each video set, understand how different stations may be using the video of political leaders in different ways, identify outliers, and find clusters of programs which share similar patterns. But how can we simply watch all of this material to begin pursuing these and other questions?
Even when we are dealing with large collections of still images–for instance, 200,000 images in “Art Now” Flickr group gallery, 268,000 professional design portfolios on coroflot.com (both numbers as of 3/31//2012), or over 170,000 Farm Security Administration/Office of War Information photographs taken between 1935 and 1944 and digitized by the Library of Congress (4)—such tasks are no easier to accomplish. The basic method which always worked when numbers of media objects were small–see all images or video, notice patterns, and interpret them–no longer works.
Given the size of many digital media collections, simply seeing what’s inside them is impossible (even before we begin formulating questions and hypotheses and selecting samples for closer analysis). Although it may appear that the reasons for this are the limitations of human vision and human information processing, I think that it is actually the fault of current interface designs. Popular web interfaces for massive digital media collections such as “list,” “gallery,” “grid,” and “slideshow” do not allow us to see the contents of a whole collection. These interfaces usually display only a few items at a time, we cannot understand the “shape” of the overall collection and notice interesting patterns.
Most media collections contain some kind of metadata such as author names, production dates, program titles, image formats, or, in the case of social media services such as Flickr, upload dates, user assigned tags, geodata, and other information (5). If we are given access to such metadata for a whole collection in the easy-to-use form such as a set of spreadsheets or a database, this allows us to at least understand distributions of content, dates, access statistics, and other dimensions of the collection. Unfortunately, online collections and media sites typically do not make a complete collection’s metadata available to users. Even if they did, this still would not substitute for directly seeing, watching, or reading the actual media. Even the richest metadata available today for media collections do not capture many patterns which we can easily notice when we directly watch video, look at photographs, or read texts–i.e., when we study the media itself as opposed to metadata about it (6).
Against Search: How to Look without Knowing What you Want to Find
The popular media access technologies of the nineteenth and twentieth centuries, such as slide lanterns, film projectors, microforms, Moviola and Steenbeck, record players, audio and video tape recorders, were designed to access single media items at a time and at a limited range of speeds. This went hand in hand with the organization of media distribution: record and video stores, libraries, television and radio would make available only a few items at a time. For instance, you could not watch more than a few TV channels at the same time, or borrow more than a few videotapes from a library.
At the same time, hierarchical classification systems used in library catalogs made it difficult to browse a collection or navigate it in orders not supported by catalogs. When you walked from shelf to shelf, you were typically following a classification system based on subjects, with books organized by author names inside each category.
Together, these distribution and classification systems encouraged twentieth-century media researchers to decide before hand what media items to see, hear, or read. A researcher usually started with some subject in mind–films by a particular author, works by a particular photographer, or categories such as “1950s experimental American films” and “early 20th century Paris postcards.” It was impossible to imagine navigating through all films ever made or all postcards ever printed. (One of the first media projects that organizes its narrative around navigation of a media archive is Jean-Luc Godard’s Histoire(s) du cinéma which draws samples from hundreds of films.) The popular social science method for working with larger media sets in an objective manner–content analysis, i.e. tagging of semantics in a media collection by several people using a predefined vocabulary of terms (for more details, see Stemler, 2001)–also requires that a researcher decide beforehand what information would be relevant to tag. In other words, as opposed to exploring a media collection without any preconceived expectations or hypotheses–just to “see what is there”–a researcher has to postulate “what was there,” i.e., what are the important types of information worth seeking out.
Unfortunately, the current standard in media access–computer search–does not take us out of this paradigm. Search interface is a blank frame waiting for you to type something. Before you click on the search button, you have to decide what keywords and phrases to search for. So while the search brings a dramatic increase in speed of access, its deep assumption (which we may be able to trace back to its origins in the 1950s, when most scientists did not anticipate how massive digital collections would become) is that you know beforehand something about the collection worth exploring further.
To put this another way: search assumes that you want to find a needle in a haystack of information. It does not allow you to see the shape of the haystack. If you could, it would give your ideas of what else there is worth seeking, beside the needle you originally had in mind. Search also does not reveal where all different needles in the haystack are situated, i.e. it does not show how particular data objects or subsets are related to the complete data. Using search is like looking at a pointillist painting at a close range and only seeing colour dots, without being able to zoom out to see the shapes.
The hypertext paradigm that defined the web of the 1990s likewise only allows a user to navigate through the web according to the links defined by others, as opposed to moving in any direction. This is consistent with the original vision of hypertext as articulated by Vannevar Bush in 1945: a way for a researcher to create “trails” through massive scientific information and for others to be able to follow those traces later.
My informal review of the largest online institutional media collections available today (europeana.org, archive.org, artstor.com, etc.) suggests that the typical interfaces they offer combine nineteenth-century technologies of hierarchical categories and mid-twentieth century technology of information retrieval (i.e., search using metadata recorded for media items). Sometimes collections also have subject tags. In all cases, the categories, metadata, and tags were entered by the archivists who manage the collections. This process imposes particular orders on the data. As a result, when a user accesses institutional media collections via their web sites, she can only move along a fixed number of trajectories defined by the taxonomy of the collection and types of metadata.
In contrast, when you observe a physical scene directly with your eyes, you can look anywhere in any order. This allows you to quickly notice a variety of patterns, structures and relations. Imagine, for example, turning the corner on a city street and taking in the view of the open square, with passersby, cafes, cars, trees, advertising, store windows, and all other elements. You can quickly detect and follow a multitude of dynamically changing patterns based on visual and semantic information: cars moving in parallel lines, houses painted in similar colors, people who move along their own trajectories and people talking to each other, unusual faces, shop windows which stand out from the rest, etc.
We need similar techniques which would allow us to observe vast “media universes” and quickly detect all interesting patterns. These techniques have to operate with speeds many times faster than the normally intended playback speed (in the case of time-based media). Or, to use an example of still images, I should be able to see important information in one million images in the same amount of time it takes me to see it in a single image. These techniques have to compress massive media universes into smaller observable media “landscapes” compatible with the human information processing rates. At the same time, they have to keep enough of the details from the original images, video, audio or interactive experiences to enable the study of the subtle patterns in the data.
Since 2008, my research lab (Software Studies Initiative, softwarestudies.com) has been developing visual techniques for interactive exploration of large visual datasets. Our techniques combine the strengths of media viewing applications, graphing and visualization applications (7). Like the latter, they create graphs to show relationships and patterns in a data set. However, if plot making software can only display data as points, lines or other graphic primitives, our software can show the actual images in a collection. We call this approach media visualization.
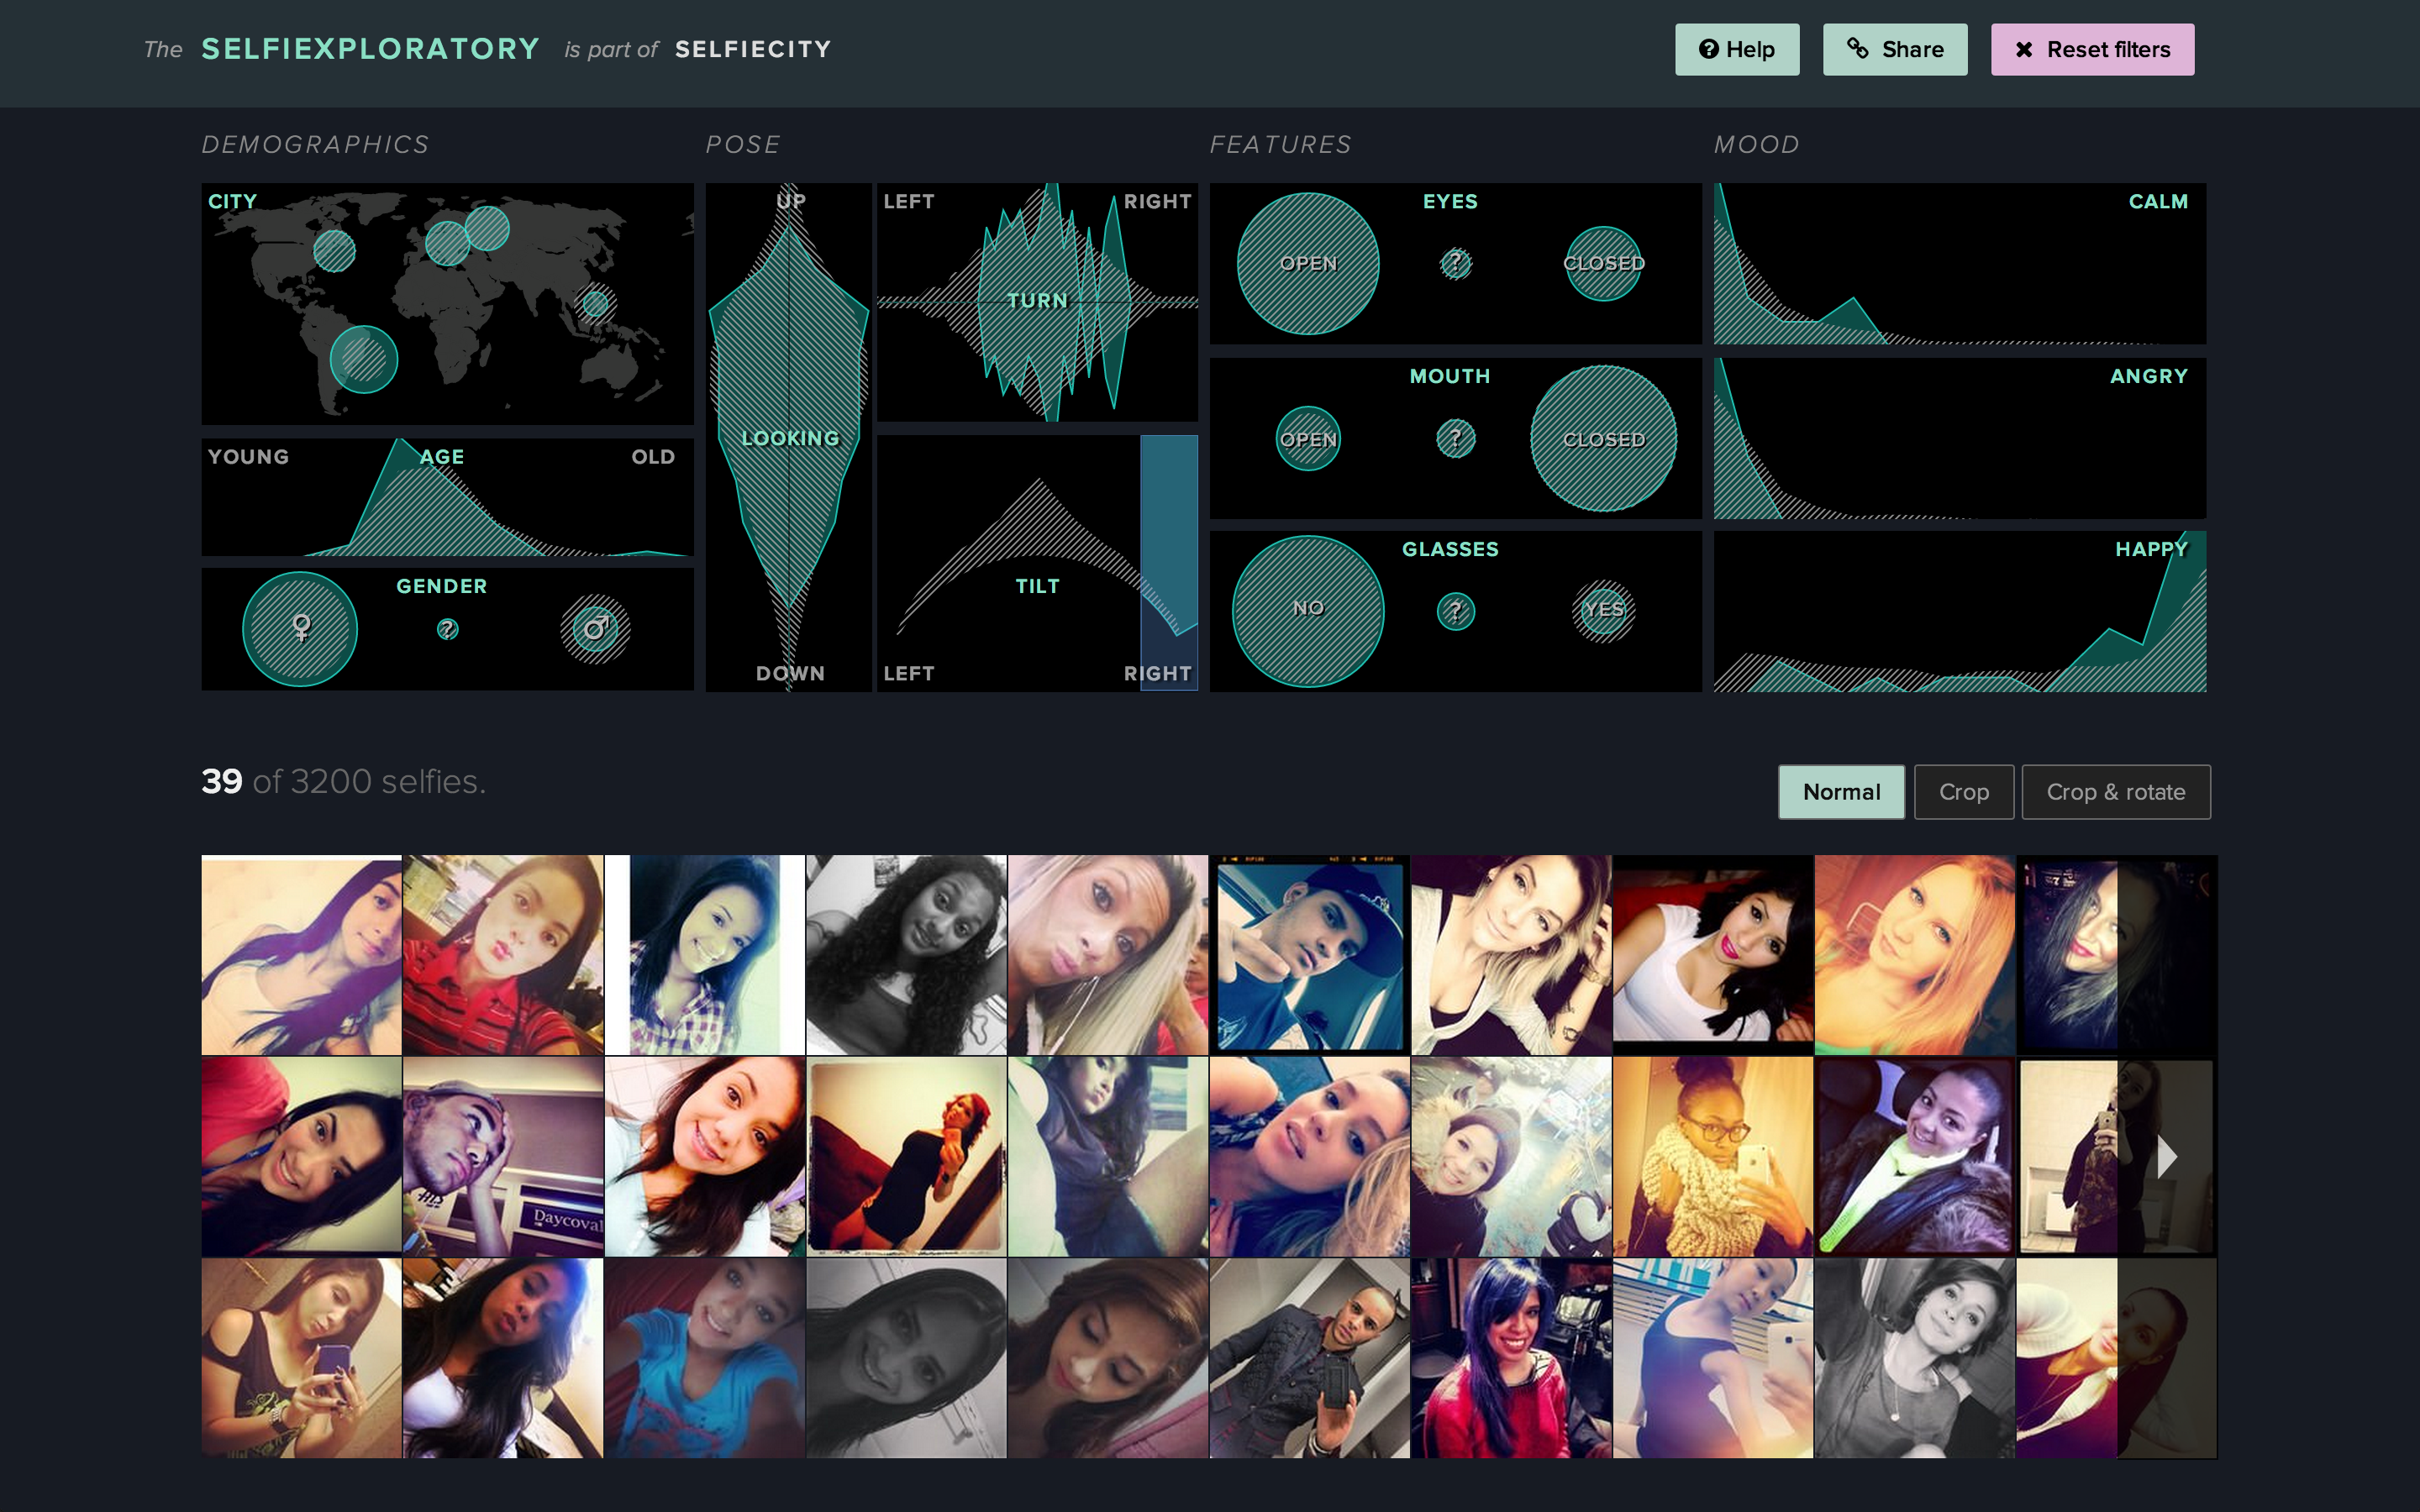
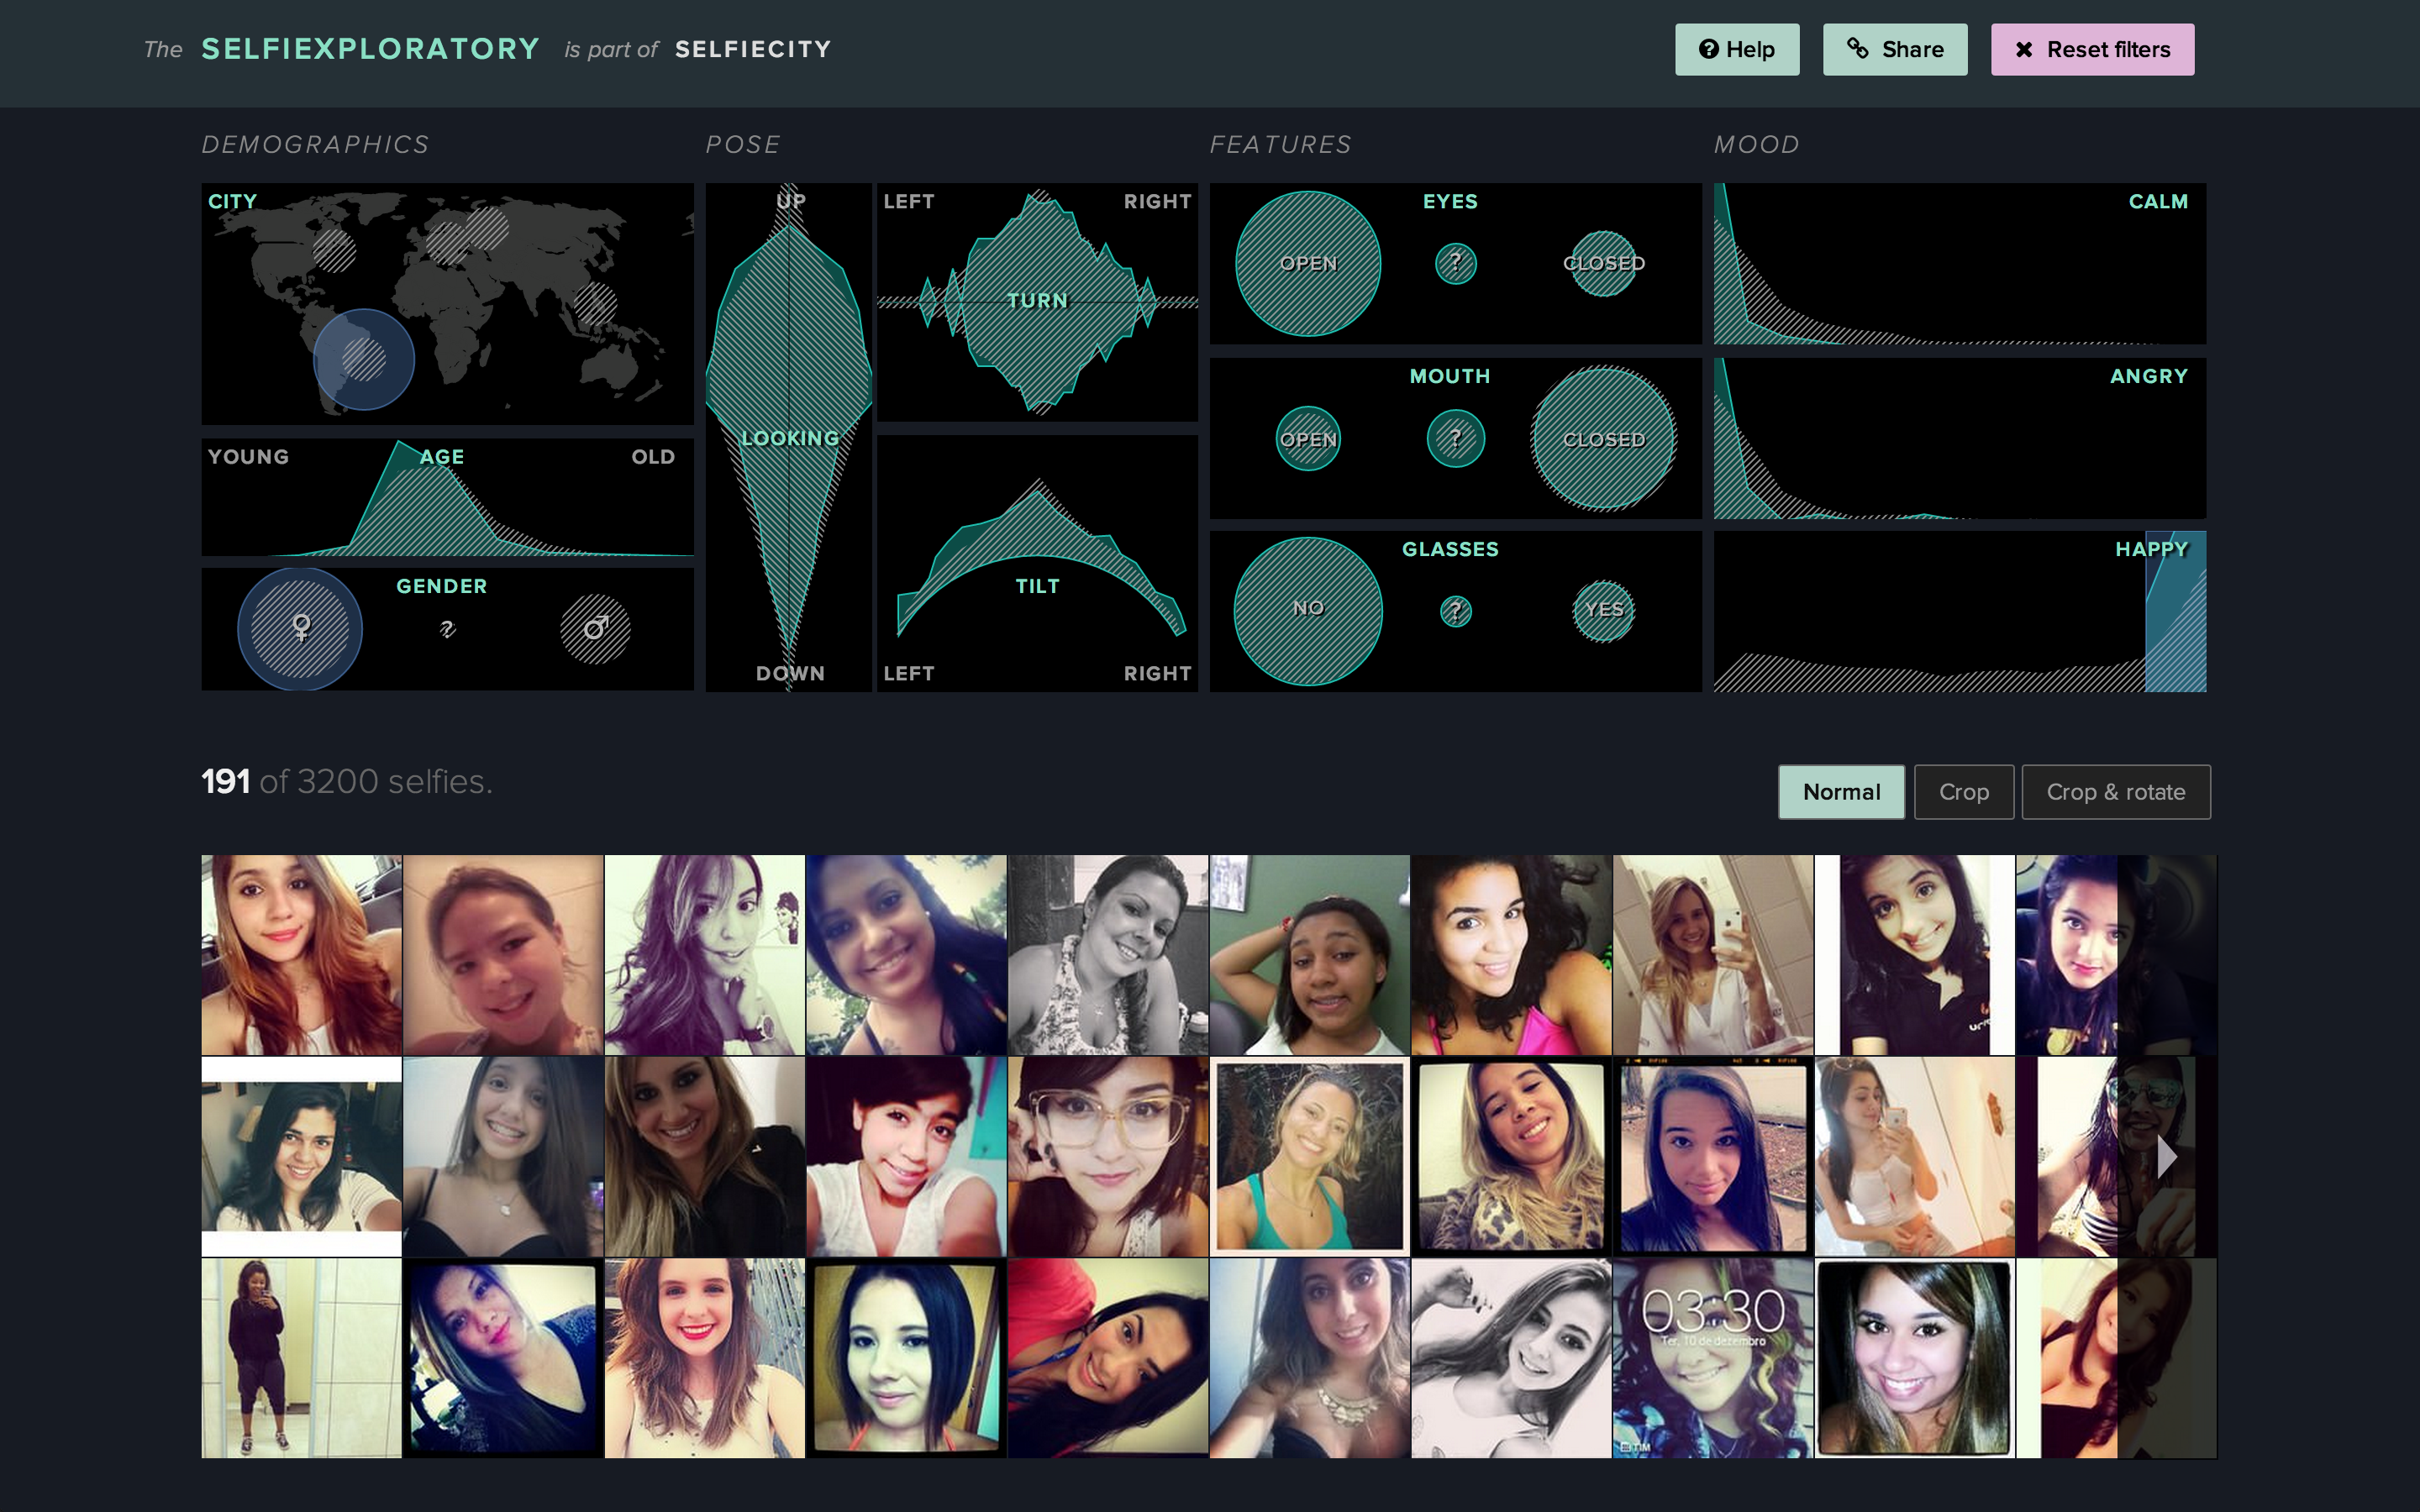
One practical example is Selfiexploratory, the web application that we created in collaboration with other media designers and software developers (the design and development was led by Moritz Stefaner). The app allows web visitors to explore a dataset of 3200 Instagram selfie photos using a number of variables such as geolocation, age estimates of people in the selfies, gender, face orientation, mood, etc.
While we feel that this app represents one successful example of how media universes can be explored interactively, we need more designers to do more experiments to come with more solutions – so we can navigate massive image and video sets without always relying on “metadata” and “search” paradigms, and have no limit to what we can discover.
2012-2014.
Notes:
1. http://www.chroniclingamerica.loc.gov
3. See our pilot project http://lab.softwarestudies.com/2011/09/digging-into-global-news.html
4. http://www.loc.gov/pictures/
5. http://www.flickr.com/services/api/
6. For a good example of rich media metadata, see http://www.gettyimages.com/EditorialImages